In September and October, Gossips maintained bar graphs to show the number of new cases and the number of active cases reported each day by the Columbia County Department of Health, and we have done the same for the month of November. The graph below shows the number of new cases reported each day. The greatest number of new cases were reported on November 4, when there were 23 new cases, but that number was two days of new cases. The highest number of new cases in a single day was on November 19, when there were 21 new cases.
The bar graph below shows the number of active cases reported each day of the CCDOH. It shows a steady increase at the beginning of the month, with the greatest number--120--reported on November 13. We actually ended the month with fewer active cases than there were when the month began--54 at the end as compared with 79 at the beginning.
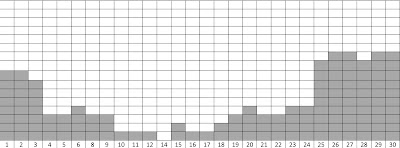
What is really stunning is to compare the graphs for the past three months: September, October, and November. The first graphs show the number of new cases.
September
There were many days in September without a new case, three days in October without a new case, but none in November.
The following graphs show the number of active cases reported in each day.
September
There was one day in September when no one in Columbia County was suffering from the coronavirus, but in October the number of active cases went from four on October 1 to 75 on October 29, and in November the lowest number of active cases for the entire month was reported yesterday, when there were 54--less than half the highest number reported in November.
Let's be careful out there.
COPYRIGHT 2020 CAROLE OSTERINK
COPYRIGHT 2020 CAROLE OSTERINK


No comments:
Post a Comment